Uniform Insights
Enterprise plan only
The Insights feature requires a Uniform Enterprise plan. Please contact your Uniform representative to provision your project with this feature.
Uniform Insights is product analytics built into the platform. It measures the experiences you build in Uniform and reports on them in the same workspace, so you can answer the questions that follow a launch without leaving Uniform:
- How is the test I launched last week performing?
- Which variation is winning, and has it reached statistical significance?
- Which personalization variation is performing best against the baseline?
- Which pages should I be optimizing?
In a composable stack, the tools that manage experiences are usually separate from the tools that measure them. Insights puts both in one place, without adding another analytics vendor.
Why use Insights?#
- See results next to the content and experiences that produced them, instead of exporting IDs into another tool to find out what happened.
- Attribute events to the composition and its dynamic input values, not just the URL, so a dynamic composition serving thousands of URLs reports as one page instead of a long tail of paths.
- Query data within seconds of collection, so you can check on a launch while it is still running.
- Collect anonymous data only. Visitor and session identifiers are generated on the device and are not linked to any identity.
- Avoid tracking pixels and third-party cookies, and route events through your own domain, so ad blockers do not erode your numbers.
- Choose whether events are collected and stored in North America or the European Union.
- Keep the analytics you already run. Insights is standalone and works alongside GA4 or any other tool.
Core features#
Project-wide dashboard#
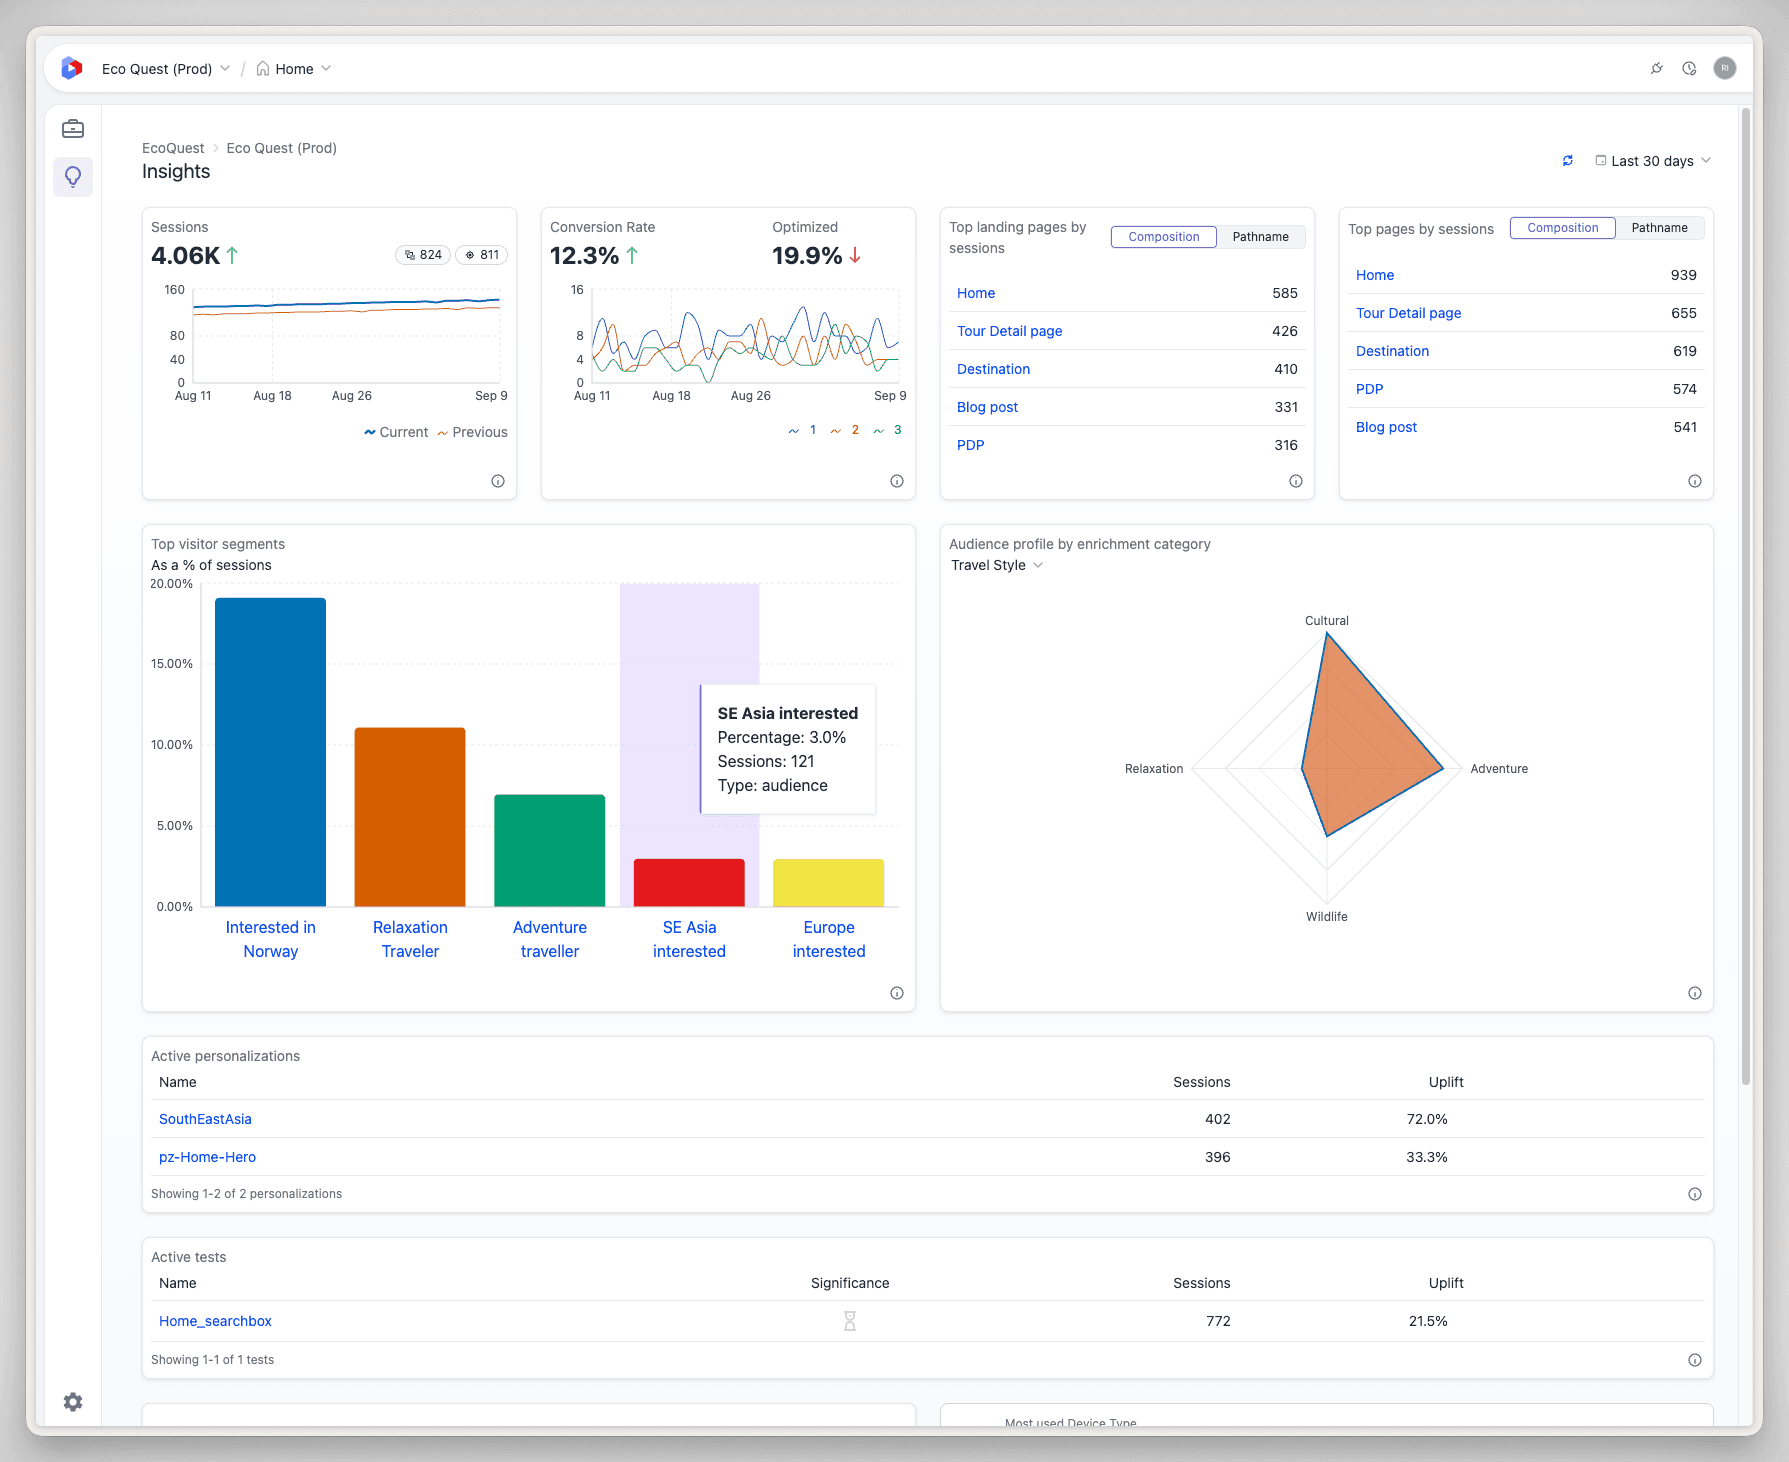
Sessions, conversion rate, bounce rate, device mix, and top pages for the period, each trended against the preceding one. A marketing optimization quadrant plots your compositions by traffic against conversions, which is usually the quickest way to find the page worth testing next.
Widgets adapt to the project: those that depend on Context entities you have not configured stay hidden rather than showing empty.
Test and personalization results in context#
Select an A/B test or personalization in the composition editor and an Insights tab reports per-variation performance in place: visits, views, bounce rate, and conversion rate per goal. A comparison mode expresses each variation as a percentage difference against the control.
A/B tests also carry a verdict. Insights runs a two-proportion z-test at 95% confidence and tells you whether a variation has separated from the control or whether the test needs more data, with the evidence behind that call.
Conversions from signals you already have#
Conversion is calculated from Uniform signals configured as goals. Because signals can be triggered from your existing data layer or analytics events, measuring a conversion rarely means writing new tracking code.
Visitor segments and audience profiles#
The audiences, intents, and signals most often assigned to visitors, as a share of sessions, plus the distribution of enrichment strength across your audience. Together they show which segments are large enough to be worth personalizing for.
Plain-language questions with Scout#
Scout can query the same data directly, which covers the questions no dashboard widget anticipated, like comparing two locales or finding traffic sources that appeared this week but not last. It answers from what it measured, and renders a chart when that makes the answer clearer.
Ready to dive in?#
How Insights works
What data is collected, where it is stored, and who can access it.
Activate Insights
Generate a tracking token and register the plugin in your front end.
Insights dashboard
Read sessions, conversions, top pages, and visitor segments.
Measure conversions
Configure a signal as a conversion goal.